Key Takeaways & Core Concepts
- NumPy ndarrays utilize contiguous C-memory blocks to deliver orders-of-magnitude faster computation than native Python lists.
- Pandas DataFrames provide flexible 2D tabular data structures with integrated indexing, filtering, and grouping.
- Handling missing values and data type conversions are essential preprocessing steps before statistical modeling.
- Vectorized calculations avoid sluggish Python for-loops, maximizing CPU and memory performance.
The Foundation of Numerical Python: Vectorized NumPy Computing
Native Python lists store pointers to individual Python objects, incurring significant memory overhead during mathematical operations. NumPy introduces the 'ndarray', a homogenous, contiguous memory block written in C. Vectorized arithmetic operations in NumPy execute element-wise across millions of data points simultaneously without the performance penalty of traditional for-loops.
Tabular Data Mastery With Pandas DataFrames
Pandas builds upon NumPy to provide DataFrames and Series, the industry-standard containers for structured tabular data. With Pandas, developers can effortlessly load CSV, Excel, SQL, and JSON datasets into memory, inspect summary statistics, filter rows based on complex boolean conditions, and perform column transformations with minimal syntax.
Data Cleaning, Imputation, and GroupBy Aggregations
Raw datasets frequently contain missing null values, duplicate entries, and inconsistent data types. Pandas provides powerful methods like 'dropna()', 'fillna()', and 'interpolate()' for clean data imputation. The 'groupby()' split-apply-combine paradigm allows data scientists to segment data by categories and compute multi-dimensional aggregates in milliseconds.
Integrating Data Visualization for Actionable Insights
Pairing Pandas with plotting libraries like Matplotlib and Seaborn enables instantaneous generation of histograms, scatter plots, correlation heatmaps, and box plots, turning raw numerical matrices into clear, visually compelling insights.
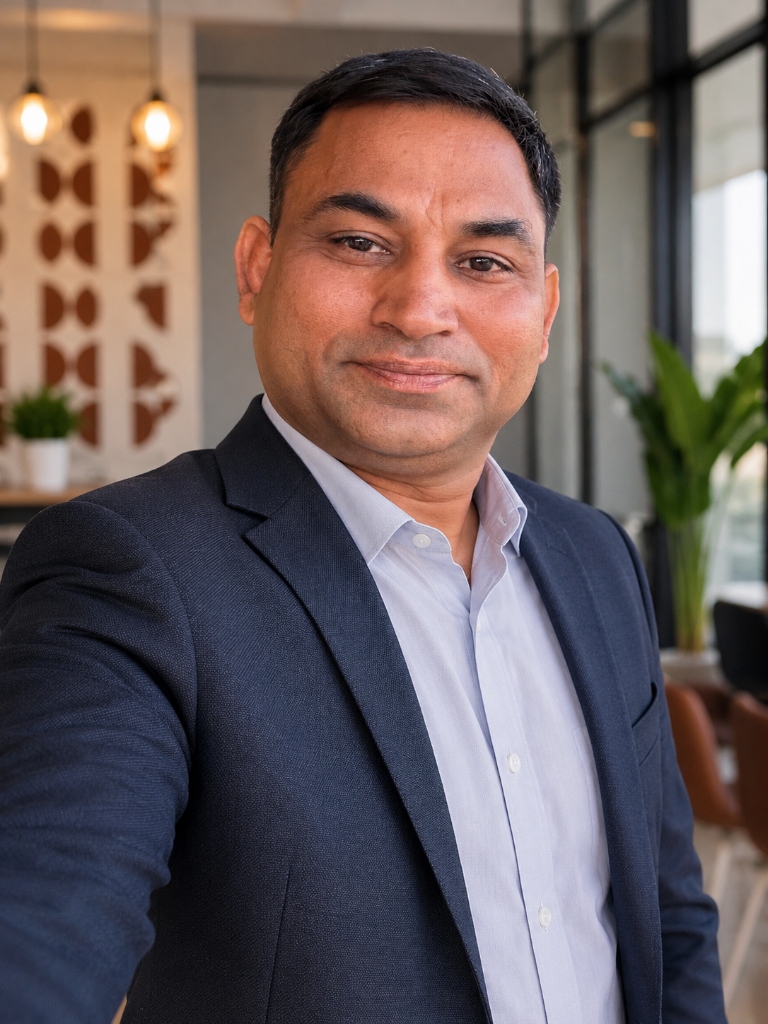
Dr. Rohit Saini
AI Consultant & Technology Lead Mentor (B.Tech, MBA). Mentoring school and college students in Python, Data Science, and modern AI architectures.